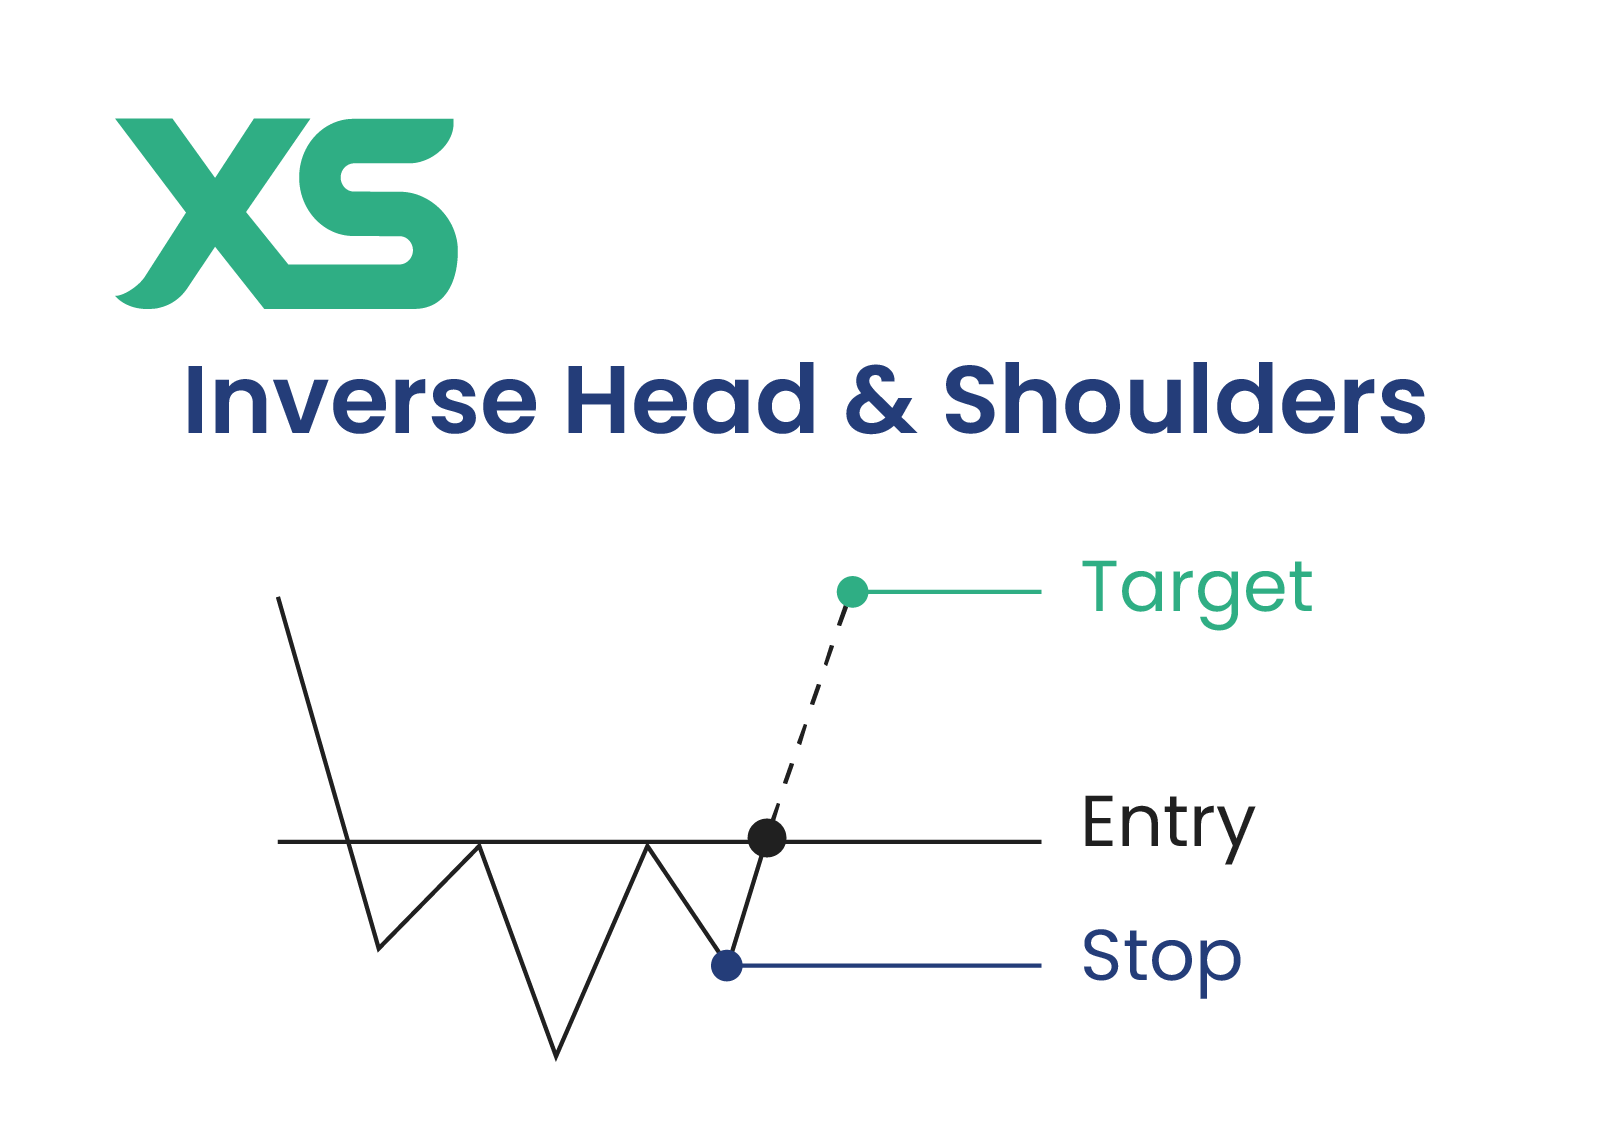
Technical Analysis · Visual Reference · 2026

17 Day Trading
Chart Patterns

A visual field guide to the price formations traders watch for reversals, continuations, momentum bursts and volume signals — grouped, colour-coded, and read at a glance.

PATTERN.IDX · synthetic series ▲ +0.00%
17
Patterns
04
Categories
3
Signal types
Bullish Bearish Both directions Neutral / direction-agnostic
01 / 04

Reversal Patterns

Signs a trend is running out of fuel and may turn. Traders hunt these at key tops and bottoms.

P01Bearish

Head & Shoulders

Head and shoulders pattern: three peaks with a higher central head

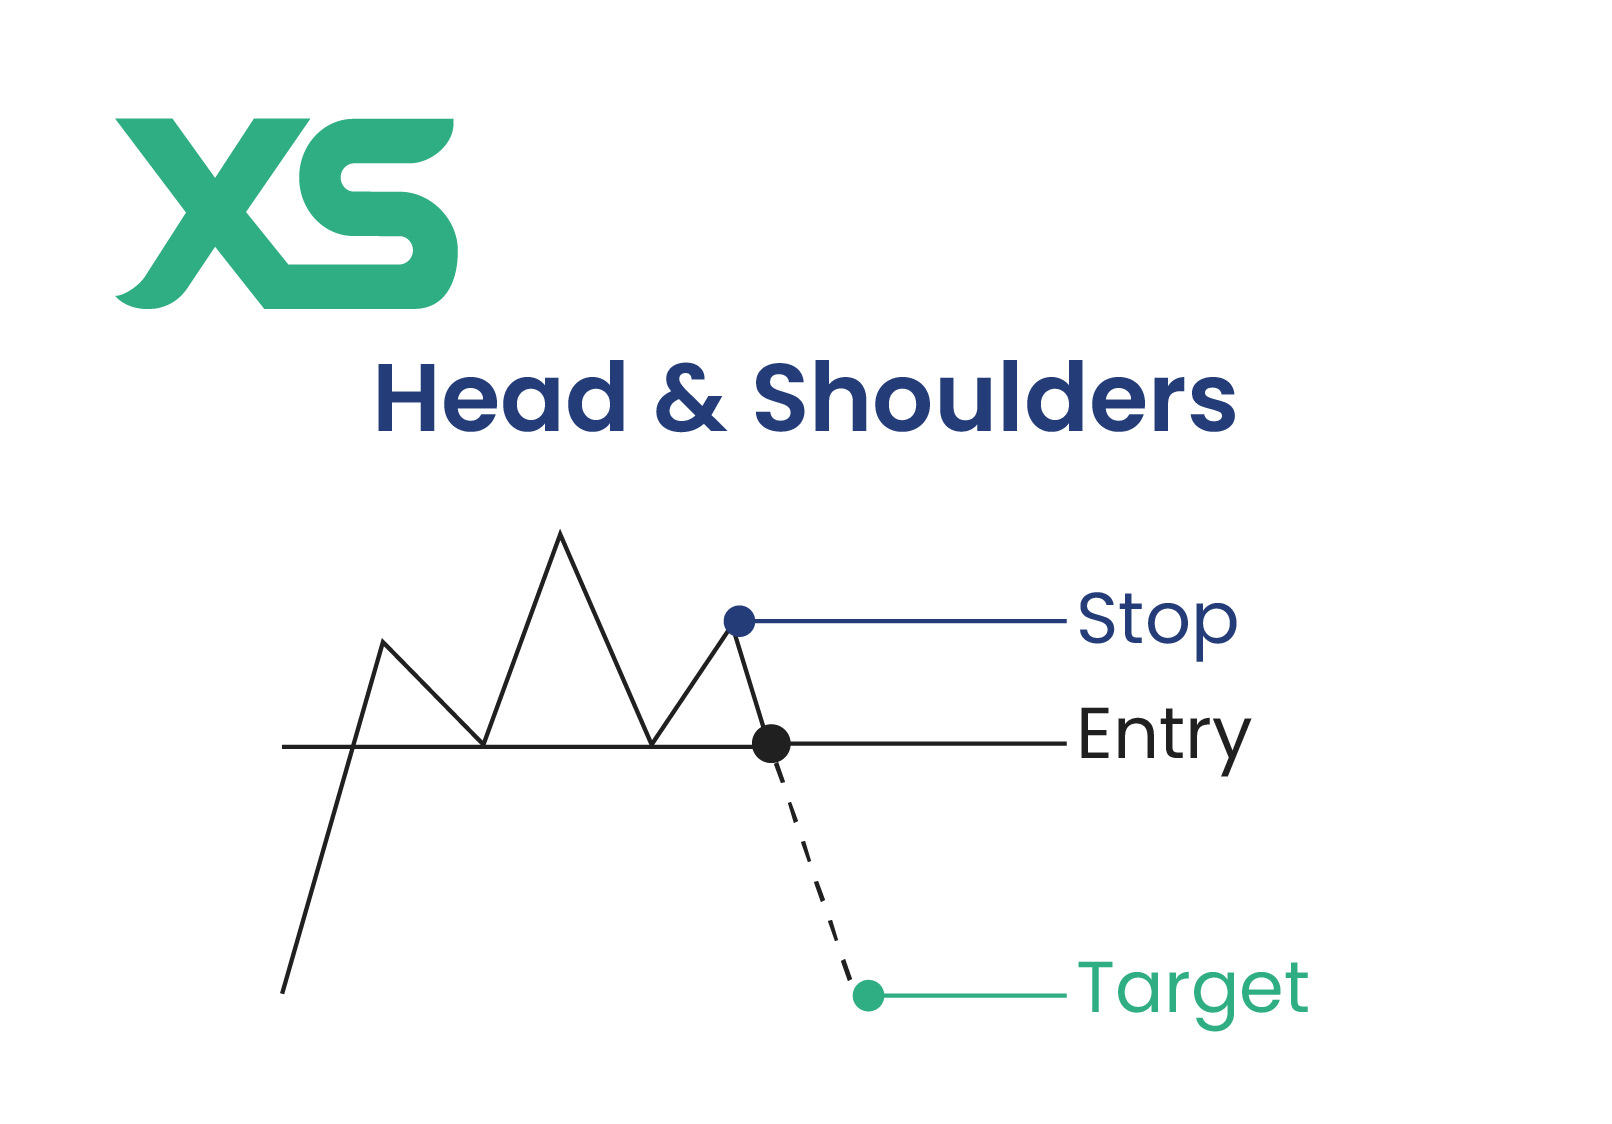
A topping shape of three peaks — a tall central head between two lower shoulders. It warns that an uptrend is losing its buyers.

  • Forms after an extended rally
  • Sell trigger on a close below the neckline
  • Target ≈ head-to-neckline depth, projected down
P02Bullish

Inverse Head & Shoulders

Inverse head and shoulders: three troughs with a deeper central trough

The topping pattern flipped upside down — three troughs with the deepest in the middle. It marks sellers exhausting and buyers stepping back in.

  • Appears at the end of a downtrend
  • Buy trigger on a break above the neckline
  • Best when volume rises into the breakout
P03Bull / Bear

Double Top & Double Bottom

Double top and double bottom patterns side by side

Price tests one level twice and fails to push through, leaving a twin-peak “M” or twin-trough “W”. Two clean rejections suggest the trend is done.

  • Double top — two failed highs, bearish
  • Double bottom — two held lows, bullish
  • Confirmed when the middle neckline breaks
P04Bullish

Cup & Handle

Cup and handle pattern: rounded base followed by a small pullback

A long rounded base (the cup) followed by a shallow pullback (the handle). The smooth recovery hints at quiet accumulation before a push higher.

  • Cup is a gradual U-shaped recovery
  • Handle is a brief, controlled dip
  • Entry on the breakout above the rim
P05Bull / Bear

Engulfing Candlestick

Bullish engulfing candlestick pattern
Bullish engulfing shown

A single candle whose body completely swallows the previous one, flipping short-term control. Bullish engulfing turns the tide up; bearish turns it down.

  • Bullish — big up-candle eats a small down-candle at support
  • Bearish — big down-candle eats a small up-candle at resistance
  • Strongest when paired with heavy volume
02 / 04

Continuation Patterns

A pause, not a turn. The trend catches its breath through consolidation, then resumes its prior direction.

P06Bull / Bear

Bullish & Bearish Flags

Bullish flag pattern
Bull flag
Bearish flag pattern
Bear flag

A sharp move (the pole) followed by a tight, slightly counter-trend channel (the flag). The breather precedes a resumption of the original move.

  • Bull flag drifts down inside an uptrend
  • Bear flag drifts up inside a downtrend
  • Breakout often matches the pole's length
P07Bull / Bear

Pennants

Bullish pennant versus bearish pennant

Like a flag, but the pause squeezes into a small symmetrical triangle as buyers and sellers tighten. The coil resolves in the prior trend's direction.

  • Forms right after a fast, vertical move
  • Converging trendlines into an apex
  • Breakout continues the original trend
P08Bull / Bear

Ascending & Descending Triangles

Ascending triangle pattern
Ascending
Descending triangle pattern
Descending

A flat barrier on one side and a sloping trendline on the other, showing one side steadily gaining ground before the level finally gives.

  • Ascending — flat ceiling + rising lows, bullish
  • Descending — flat floor + falling highs, bearish
  • Volume usually surges on the break
P09Neutral

Symmetrical Triangle

Symmetrical triangle pattern

Highs step lower and lows step higher into a narrowing coil, with neither side in clear command. It stays direction-neutral until price escapes an edge.

  • Two converging trendlines, no built-in bias
  • Breakout often follows the prior trend
  • Tightening range precedes a volatility burst
P10Bull / Bear

Rising & Falling Wedges

Rising wedge versus falling wedge

A tilted, narrowing range where both lines slope the same way. A rising wedge leans up but tends to break down; a falling wedge leans down but tends to break up.

  • Rising wedge — usually a bearish resolution
  • Falling wedge — usually a bullish resolution
  • Prior trend decides reversal vs continuation
03 / 04

Momentum Patterns

Bursts of one-sided pressure — the price acceleration that kicks off, or confirms, a strong directional move.

P11Neutral

Breakout

Breakout pattern through a key level

Price pushes decisively through a well-watched support or resistance line, often starting a fresh leg. Conviction shows up as a strong close and a jump in volume.

  • Clears a key level on expanding volume
  • Can start a new trend or extend an old one
  • Thin-volume breaks are prone to fail
P12Neutral

Gaps

Common, breakaway, runaway and exhaustion gaps

An empty space where price leaps between sessions with no trading in between. The type — common, breakaway, runaway or exhaustion — tells you where you are in a move.

  • Breakaway gap launches a new trend
  • Runaway gap confirms an ongoing trend
  • Exhaustion gap warns the trend is tiring
P13Bull / Bear

Island Reversal

Island reversal pattern

A cluster of candles stranded by a gap on the way in and an opposite gap on the way out, left floating apart from the trend. It signals an abrupt change of heart.

  • Gap out, consolidate, then gap back the other way
  • Marks a sharp sentiment flip
  • Often follows an exhaustion gap
P14Bull / Bear

Three Soldiers & Three Crows

Three white soldiers versus three black crows

Three strong candles in a row, each closing further in the same direction. White soldiers show relentless buying; black crows show relentless selling.

  • Soldiers — three rising green candles, bullish
  • Crows — three falling red candles, bearish
  • Each opens within the prior body, closes beyond it
04 / 04

Volume Patterns

Volume is the lie detector. These signals weigh participation behind a move to separate real conviction from noise.

P15Neutral

Volume Spike + Price Action

SPIKE

A sudden burst of volume that backs a price move, separating real conviction from drift. When the spike lines up with a breakout or reversal, the signal carries more weight.

  • Surging volume means genuine interest
  • High-volume moves are more likely to hold
  • A move on thin volume is suspect
P16Bull / Bear

Support & Resistance Bounces

Support and resistance levels with price bouncing

Price reaches a familiar floor or ceiling and reverses as traders defend the zone. Strong volume on the bounce shows the level is being respected.

  • Bounce off support on volume — buyers defending
  • Rejection at resistance on volume — sellers defending
  • Quiet levels are likelier to break than hold
P17Bull / Bear

VWAP Reversals

VWAP indicator with price reverting to the line

The volume-weighted average price acts as an intraday fair-value line. Stretched far from VWAP, price tends to snap back toward it.

  • Far above VWAP — overbought, fade risk
  • Far below VWAP — oversold, bounce risk
  • Institutions treat VWAP as a benchmark
+ / 03

Trading Them Effectively

A pattern is a hypothesis, not a guarantee. Three habits keep the odds on your side.

01

Confirm with indicators

Don't trade a shape on its own. Let a second tool agree before you commit.

  • RSI for overbought / oversold
  • MACD for trend and momentum
  • Moving averages as dynamic levels
02

Define your risk first

Decide where you're wrong before you enter, and size the trade around it.

  • Stop just past the invalidation point
  • Target from the pattern's projection
  • Aim for at least a 1:2 reward-to-risk
03

Read the volume

Participation tells you whether a break is real or a trap.

  • High-volume breaks tend to follow through
  • Low-volume breaks invite fakeouts
  • Use VWAP to gauge fair value